
Building Automation
BACnet Integration and the Power of Analytics
SCROLL
Analytics detail how a simple set point change can affect the rest of the system.
We were recently asked by a client to review his system and evaluate the energy savings to seal up the supply ductwork. The building is conditioned by three packaged rooftop units that serve the spaces through a mix of cooling-only and-fan powered variable air volume (VAV) boxes. The ductwork design is unique in that the supply ductwork runs down the middle of the return ductwork — it's concentric. There is a building automation system (BAS), and the rooftop units are BACnet integrated, so we have a larger amount of data available for our analysis. The BAS system pushes data out to a building analytics server, where we can crunch the data.
During the heat of summer, the client noticed the building was struggling to cool. The client’s staff had already performed a survey of the air distribution system and discovered the supply air duct had visible gaps in the seams. Trying to diagnose the extent of the problem on the BAS can be tedious and may only provide a snapshot of what is occurring.
Pushing the building data out to an analytics server allowed us to dive deeper into the system. This is where BACnet integration comes in handy. It’s simple to discover points in our analytics software, and it allows us to quickly poll those points for data. Once we have data, we tag our points utilizing the haystack standard and then begin to investigate. In this particular case, our goal was less about providing a specific and precise dollar amount of savings but more about finding a way to visualize the customer’s problem in an easy-to-digest manner, so anyone with limited HVAC knowledge could understand the importance of prioritizing the repairs. To get us in the ballpark, we refer to the sensible cooling formula below. We are conscious this equation does not account for our latent cooling load, but, again, it gets us in the ballpark to base our estimations. Many times, as energy engineers, we can get caught up being overly precise, spending too much time being specific. Sometimes, a customer just needs a direction to base a decision. In this case, if we can document a notable problem in the building, then they are going to fix it. So, quickly comparing sensible loads is enough to get it done.
Qsensible = CFM × ΔT × 1.08
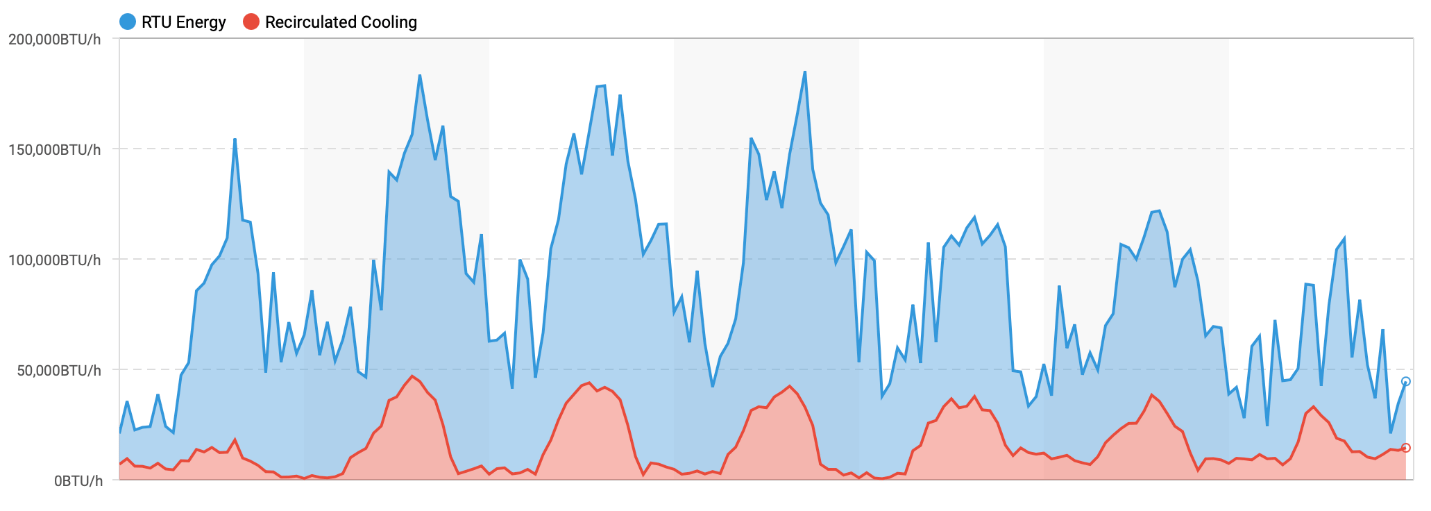
FIGURE 1: The estimated rooftop unit energy in Btuh shown in the blue, and the delta of the project’s two equations in red.
Images courtesy of CMS Controls
Once we started diving into the data, we realized we have no cfm measurement on the rooftop unit. This is where haystack tagging shines, as we can quickly totalize all the cfms of our VAV boxes associated with our rooftop units by only referring to a couple specific tags. As we touched on in last month's column, analytics software differs from each BAS by its ability to easily aggregate and standardize time series data. Now that we have our cfm, we can use the return air temp sensor on the unit as well as the discharge air temp sensor to plug into our equation. Our goal is to show how much of these calculated Btu are most likely being recirculated into the return and never making it into the space itself. Using the same sensible cooling equation, this time we aggregate and average all of our zone temp sensors related to the spaces each rooftop unit cools. Averaging the zone temps together allows us to build a “virtual” return temp, so to speak. In a normal functioning system, we expect the return air temp on the unit to be, at the very least, the same temp as our zones, if not hotter, due to additional heat above the ceiling from the lights. All this allows us to create the data in Figure 1, which illustrates the estimated rooftop unit energy in Btuh shown in the blue, and the delta of our two equations in the red.
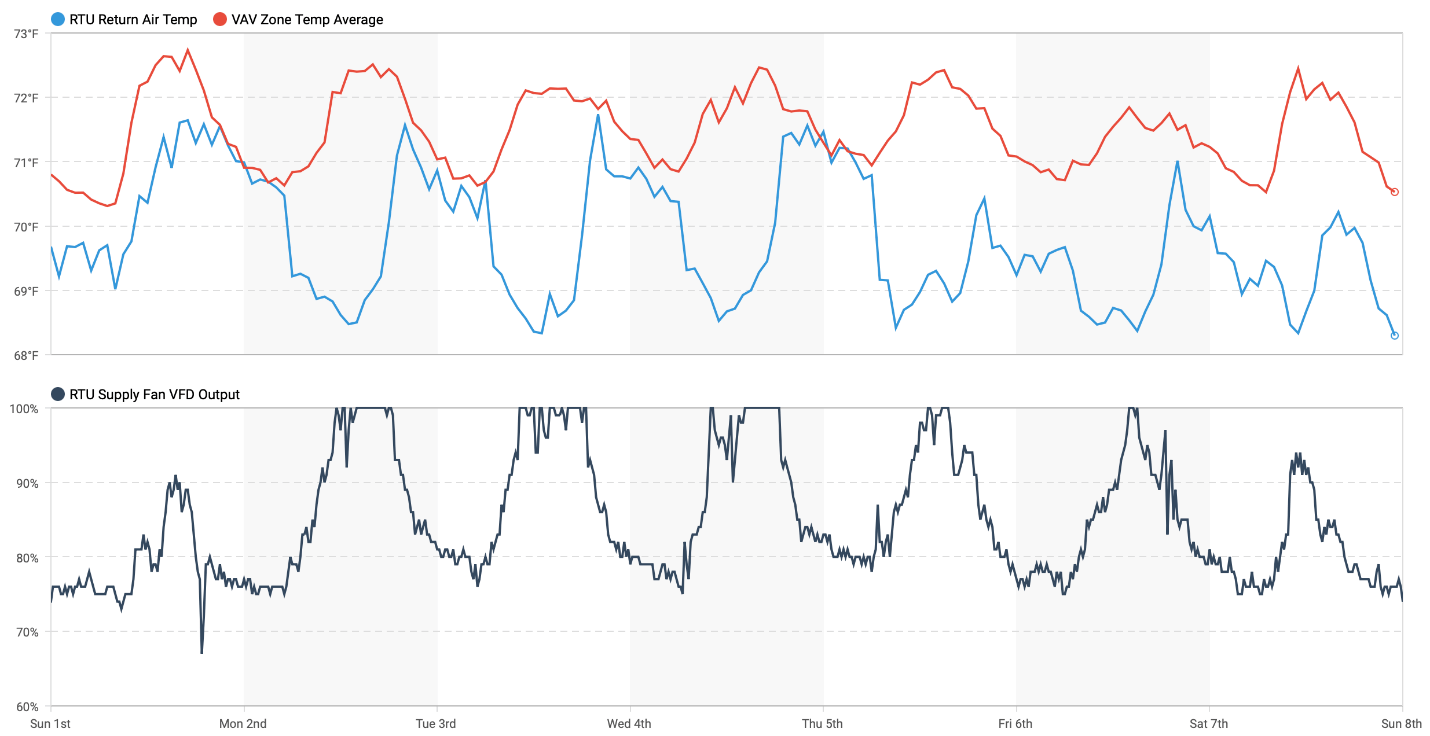
FIGURE 2: When the supply duct pressure increases or the supply fan VFD speeds up, a greater delta T between the two values emerges.
By comparing the average zone and return temperatures on each rooftop unit, it’s evident the return temperature is cooler than the average space temperatures, clearly pointing to a leakage of the supply ductwork. Furthermore, when the supply duct pressure increases, or the supply fan VFD speeds up, we see a greater delta T between the two values, as can be seen in Figure 2.
At this point, it’s clear there are potential savings to be had by sealing up the supply ductwork. What we want to illustrate is the information gained from BACnet integrating the rooftop units into the BAS allows us to quickly and easily compare points across the system using the power of the analytics platform. Pulling in supply fan VFD speeds allowed us to verify our initial leaky duct observation. The analysis performed on this data would be difficult using just the capabilities of the BAS. Analytics gives us a greater amount of detail to understand a building and how a simple set point change can affect the rest of the system. In this building, it improved our vision, and the customer’s, into the supply air leakage.
Mike Davis, P.E.
Mike Davis has been working in the built environment since 1998. He started as a sales engineer working for York International, selling large chillers, standard modular, and custom air handlers with a strong focus on supporting design engineers. Eventually, he went to work for one of these engineers, Moseley Architects, designing HVAC systems for various clients. He took an energy engineering role with Piedmont Service Group in Raleigh, North Carolina. Here, he supported clients with energy efficiency through optimizing their building automation systems or HVAC equipment replacements. During this time, he earned his certification as a professional engineer in the state of North Carolina for mechanical engineering. He also earned his Certified Energy Manager (CEM) and Certified Measurement and Verification Professional from the Association of Energy Engineers (AEE). He currently works for CMS Controls, a provider for building automation projects in the Georgia, South Carolina, North Carolina, Virginia, and the Pittsburgh areas.

James Regan
James Regan has been working in the building automation industry since 2013. He started as a controls technician for Johnson Controls, working primarily in critical hospital environments. He moved on to an energy engineering role optimizing the automation systems of hospitals with a major focus on maintaining proper air quality settings as efficiently as possible. In 2018, he accepted a role as building systems analyst with Piedmont Service Group. In this role, he supported efforts to increase efficiency through identifying poor sequences, faulty field devices, or failing mechanical equipment. He currently is the analytics manager overseeing the building analytics platform where he supports Piedmont Service Group and CMS Controls with optimizing or continuous commissioning through analytics.